13 — Platform · Dashboards · GIS · Integrations

Uzenergo

A vehicle monitor that grew into a national platform.

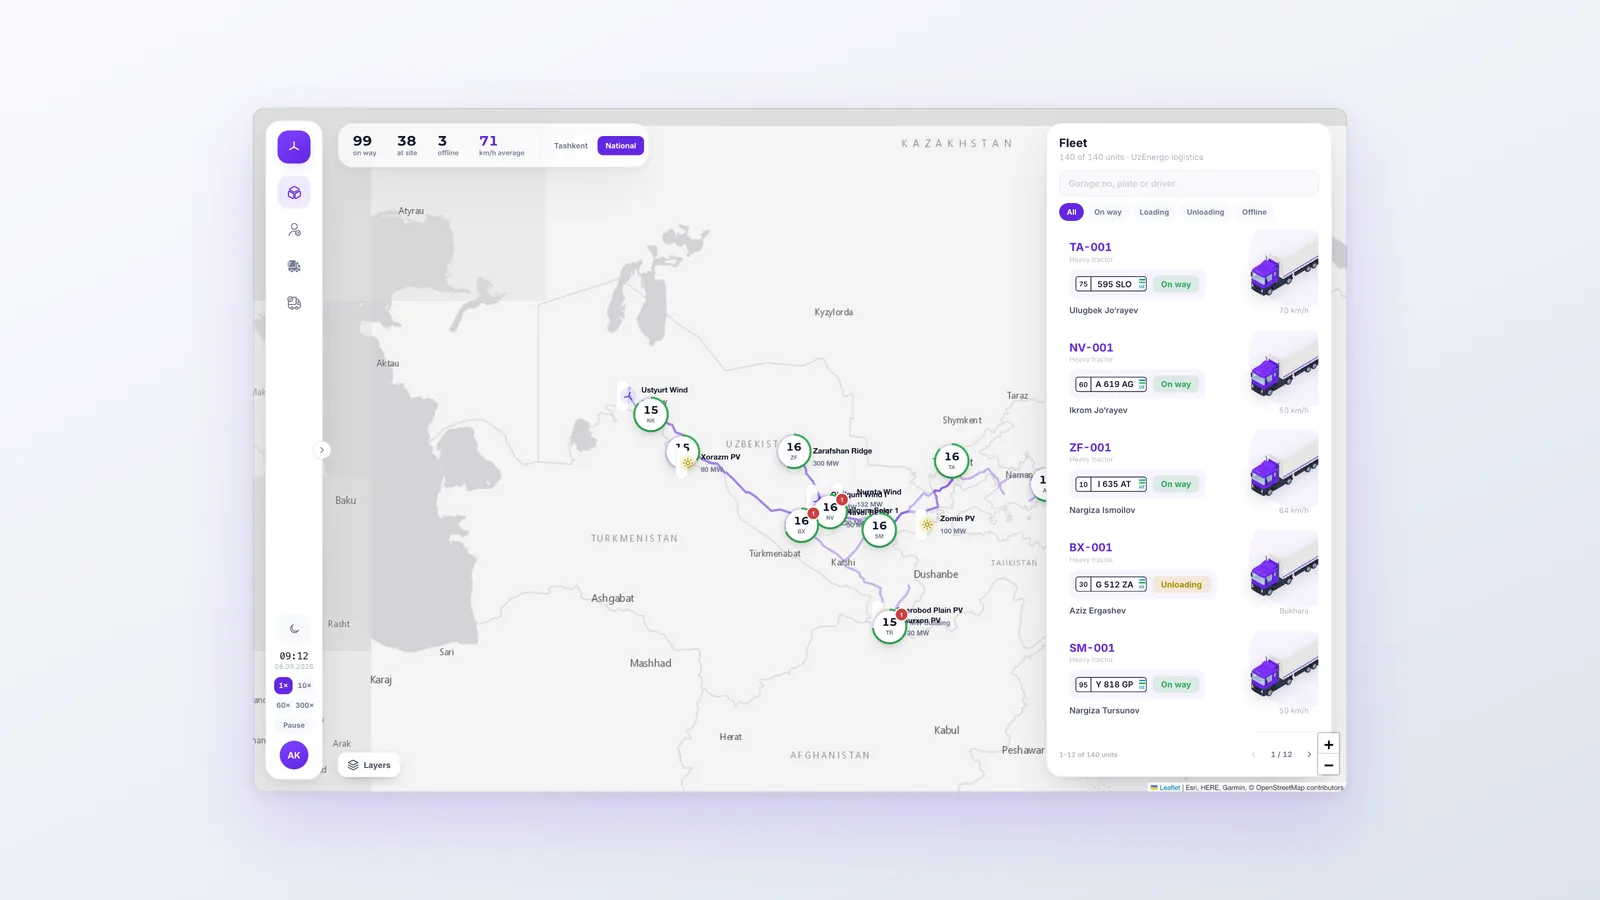
An energy group needed one view of its trucks, sites and crews. Over two years a transport monitor grew into PLATUZ — one platform for fleet, dispatch, wind and solar sites, maintenance and the executive board — and we still run it.

Uzenergo — A vehicle monitor that grew into a national platform.
Client
Uzenergo
Sector
Energy assets and heavy transport
Scope
Research, platform, GIS, data, DevOps
Delivered
2 years in 8 stages · ongoing support
What it runs
140
Vehicles in 12 classes
9
Depots across the country
10
Wind and solar sites, 171 turbines
1,412 MW
Operating capacity

Figures from the synthetic demo model; the client's own data stays private.

  1. The problem

    Every answer started with a phone call.

    Vehicle positions, jobs, maintenance logs and site reports lived in separate systems that updated at different speeds. Staff reconciled them by phone and spreadsheet, and every level of management got its own report.

  2. What we did

    Two years, one working release at a time.

    We started with a transport monitor and never froze a two-year spec. Each stage went from interviews and a prototype to a pilot and production: the command map, fleet, dispatch, depots, maintenance, energy sites, integrations, the board and a driver app.

  3. The outcome

    One picture, from turbine to truck.

    Dispatchers, engineers and executives now read the same data at their own depth. The daily summary takes 18 minutes instead of five hours, and a vehicle's status 40 seconds instead of 22 minutes.
The film
The five-second ad: a vehicle monitor, two years of working releases, one operating picture.
How it ran

Eight stages, no frozen spec.

  1. Research & pilots
  2. Command map & GIS
  3. Fleet & dispatch
  4. Energy operations
  5. Integrations & data
  6. Rollout & support

A diagram of how the work was arranged, not a timed schedule. The first working screen came in week six, and every stage reached a pilot group before it went national.

What we were given
  • A brief for vehicle monitoring
  • Data in several separate systems
  • Access to dispatchers, sites and depots
What we delivered

Research & design

  • Interviews and site observation
  • PLATUZ identity and design system
  • Light, dark and control-room themes

Platform

  • Command map on real road geometry
  • Fleet & Vehicle 360 and dispatch
  • Energy operations and the board

Data & integrations

  • Telemetry ingestion and events
  • Integration hub and messaging
  • Data warehouse and analytics

Rollout & care

  • Staged national rollout
  • Training for 620 people
  • 24/7 support, 164 releases
From a signal to a decision

One picture, different depths.

A dispatcher, an engineer and an executive look at the same data, each at the depth their role needs.

  1. Where data comes from
    • GPS and CAN telemetry
    • Wind and solar sites
    • ERP, HR and fuel cards
    • Drivers in the field
  2. What PLATUZ joins
    • Vehicle and route
    • Asset status and alarms
    • Permits and documents
    • Crew and shift
    Kept on one timeline
  3. Who acts on it
    • Dispatch
    • Engineers on site
    • The executive board
    • The driver's app
The identity

Mark, wordmark, palette and face are the platform's own, set here in code. PLATUZ is the portfolio name of the internal platform.

PLATUZ
PLATUZ
  • PLATUZ violet#6227E3
  • Bright violet#7E43FF
  • Ink#12172B
  • Workspace#EEF1F8
  • Control room#0E1220
Montserrat · with Inter for data

One operating picture.

140 vehicles · 9 depots · 1,412 MW

  • PLATUZBlade section B-3Convoy permit
  • PLATUZWTG-18Maintenance tag
  • PLATUZ01 A 486 BCVehicle window card
The brand outside the screen

Proposed applications, made for this case — not photographs of the client's sites.

  • The command map in the depot gatehouse
  • Route clearance, checked against the map at the roadside
  • A blade on its cradle, with the route beside it
  • The energy view inside a nacelle hatch
  • The board on a solar inverter cabinet
  • Fleet data at a fuel tanker's manifold
In their words
Westartedwithoutaperfectspecjustabiggoalandafewobviousproblems.Noemodidnottrytofixatwo-yearprojectinonedocument.Theyshippedworkingstages,showedtheeffectanddecidedthenextstepwithus.Itgrewfromatransportmapintoonespaceforoperations,energysitesandmanagement.
Azamat MirnovExecutive management, the energy group
  • Every hard question used to start with calls: where is the vehicle, who is assigned, is the route still valid. Now the whole chain is in one window, and exceptions show up before they become problems.
    Ibrahim MamazadeHead of central dispatch
  • Over two years the data, integrations, roles and infrastructure all changed, but the architecture held. After launch the project was not handed over as an archive — the team kept watching the platform and owning the SLA.
    Gulbakhor OlimjonovaHead of the digital transformation programme
What it brought
  1. 18 minFor the daily summary, down from 5 hours
  2. 47 → 9 minTo assign a dispatch job
  3. ≈$3MEstimated effect in the first full year
  • 78.6% → 94.2%Heavy transport on time
  • −28%Unplanned vehicle downtime
  • 164Releases in 18 months of support

Next case

Start a project

The next onestarts here.

Tell us what you are building. If it is a fit you will have an offer — and if not, we’ll tell you upfront.

Prefer to writehej@noemo.se

This site uses cookies. The necessary ones are already on; the rest wait for you. Cookie policy

Necessary

Remembers the answer you give here and keeps the site working. There is nothing else in this group.

Always on

Analytics

Counts visits, shows us which pages are read, and records how a page is used — never what you type into a form. Off until you turn it on.

Marketing

Would let us see which advertisement brought you here. Nothing is in this group today, and we will ask again before anything is.